As a class assignment, it was proposed that an MX-25 sensor be installed on the belly of a Gulfstream G550. This post includes my analysis of the drag impact that the sensor will have across the aircraft’s flight envelope and the impact that installing the sensor could have on an antenna already installed on the belly of the aircraft.
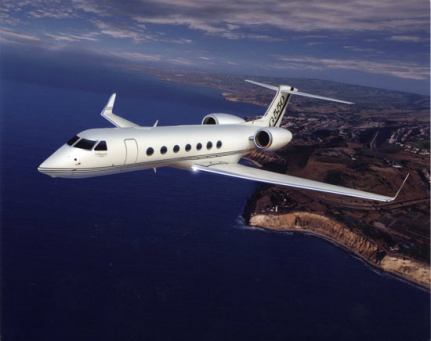
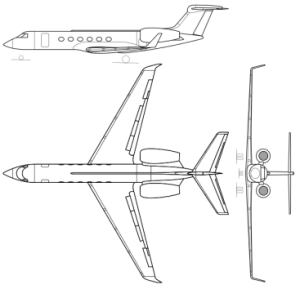
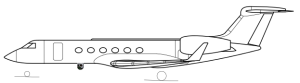
It has been proposed to install an MX-25 sensor on the belly of a Gulfstream G550 aircraft. First, the Gulfstream G550 is a business jet for 14-19 passengers. It is about 96 feet long with a wingspan of 93.5 feet and weighs 48,000 pounds, to give an idea of the size. Its service ceiling is 51,000 feet. The images below provide a visual of the aircraft.

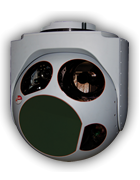
The proposed MX-25 sensor is a fully digital, high definition, long range imaging and targeting system. It is ideal for high altitude, long-endurance intelligence, surveillance, and reconnaissance missions. The system weighs about 220 pounds with a diameter of 25.7 inches and a height of 30.2 inches. The image below provides a visual of the MX-25 sensor.
The following image shows a scale representation of the sensor attached to the belly of the aircraft.
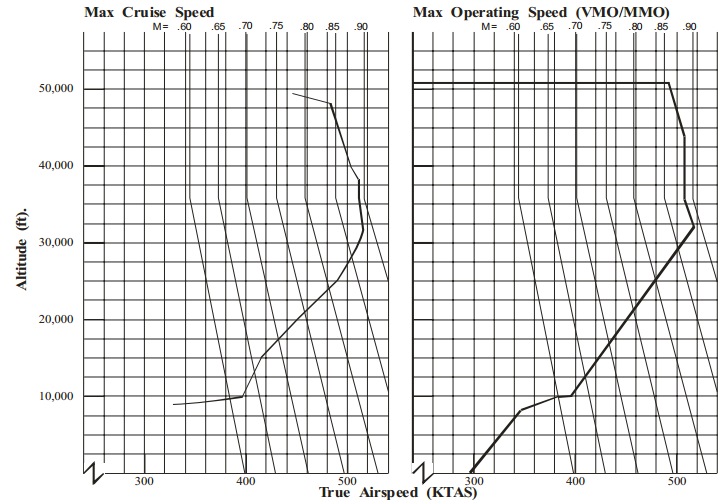
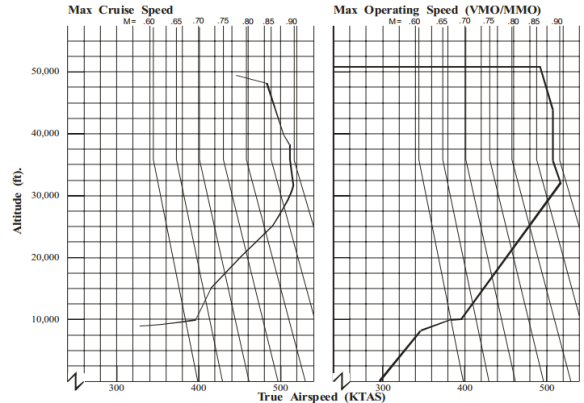
An estimate of the drag impact that the sensor will have across the aircraft’s flight envelope has been requested. The following graph shows the flight envelope of the Gulfstream G550, obtained from a data book on corporatejet.com. For our applications, the graph on the far right will be used, “Max Operating Speed (VMO/MMO)”.
The data book from corporatejet.com also provides values that can be used for stall speed. As the graph above does not provide stall speeds, we will use the given values shown below for VMC Ground and Air. Below these speeds, the aircraft cannot be adequately controlled.
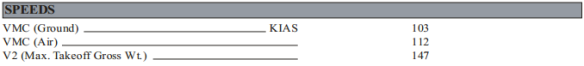
Note that 1 knot is equivalent to 1.68781 feet per second. Therefore, VMC (ground) is 173.844 ft/s and VMC (air) is 189.035 ft/s.
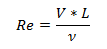
Reynold’s number is then calculated using the following equation where V is the velocity, L is the reference length (in this case 2.14 feet for the diameter of the sensor), and ν is the kinematic viscosity.
The following table summarizes the results of finding the Reynold’s number at the corners of the flight envelope. Kinematic viscosity and speed of sound values are found on page 364 in the textbook “Dynamics of Flight” by Etkin and Reid.
|
Location in Flight Envelope
|
Altitude |
Kinematic Viscosity |
Speed of Sound |
Mach |
Velocity |
Re |
|
ft
|
ft2/s |
ft/s |
|
ft/s
|
|
|
Bottom Left Corner (Stall @ Ground)
|
0
|
1.57E-04 |
1116.4 |
0.156 |
173.844 |
2.37E+06 |
|
Top Left Corner (Stall in Air)
|
51000
|
8.56E-04 |
968.08 |
0.195 |
189.035 |
4.73E+05 |
| Top Right Corner |
51000 |
8.56E-04 |
968.08 |
0.850 |
822.868 |
2.06E+06
|
| Bottom Right Corner (Intersecting x-axis) |
0 |
1.57E-04 |
1116.4 |
0.454 |
506.343 |
6.89E+06
|
The sensor will be modeled as a rough sphere. The following table from NASA relates the Reynold’s numbers previously found to a value for CD over a sphere.
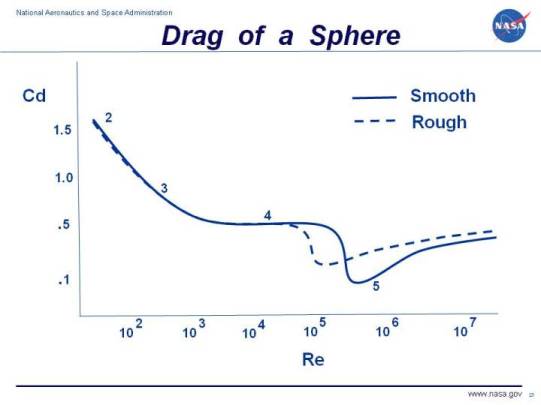
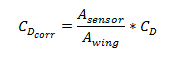
Using the ‘rough’ line on the above chart, drag counts were found and corrected with reference to the wing area. Also, this chart shows that the sensor will be operating in the supercritical flow regime because all calculated Reynold’s number are between 105 and 107. The corrected CD is formulated using the following equation where is 3.6 ft2 (the cross-sectional area of the sensor) and is 1137 ft2 (the wing area of the Gulfstream G550).
The results are summarized in the table below.
|
Location in Flight Envelope
|
Altitude |
Mach |
Re |
Cd |
Cd Corrected |
Drag Count |
Locally Transonic?
|
|
ft
|
|
|
|
|
|
|
|
Bottom Left Corner (Stall @ Ground)
|
0 |
0.156 |
2.37E+06 |
0.3 |
0.000949026 |
9.490 |
No |
|
Top Left Corner (Stall in Air)
|
51000 |
0.195 |
4.73E+05 |
0.2 |
0.000632684 |
6.327 |
No
|
|
Top Right Corner
|
51000 |
0.850 |
2.06E+06 |
0.3 |
0.000949026 |
9.490 |
Yes
|
|
Bottom Right Corner (Intersecting x-axis)
|
0 |
0.454 |
6.89E+06 |
0.4 |
0.001265368 |
12.654 |
No
|
The drag count was also calculated within the flight envelope at an altitude of 30,000 feet. The results are summarized in the table below.
|
Altitude
|
Mach |
Re |
Cd |
Cd Corrected
|
Drag Count |
Locally Transonic? |
|
ft
|
|
|
|
|
|
|
|
30000
|
0.300 |
1.83E+06 |
0.3 |
0.000949026 |
9.490 |
No
|
|
30000
|
0.500 |
3.05E+06 |
0.4 |
0.001265368 |
12.654 |
No
|
|
30000
|
0.700 |
4.27E+06 |
0.4 |
0.001265368 |
12.654 |
Yes
|
|
30000
|
0.800 |
4.88E+06 |
0.4 |
0.001265368 |
12.654 |
Yes
|
|
30000
|
0.900 |
5.49E+06 |
0.45 |
0.001423539 |
14.235 |
Yes
|
As shown in the above tables, the sensor will increase the drag on the aircraft by anywhere from approximately 6 to 14 drag counts across the entire flight envelope if it is installed on the belly of the Gulfstream G550.
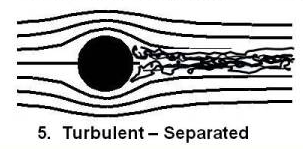
There is concern that installing the MX-25 sensor will interfere with a quarter-wave UHF communications antenna that is already installed on the aircraft and a proposed GPS antenna. After doing some research, UHF signals may be blocked by items in their path. Because this is a small antenna installed behind the proposed sensor, the sensor could interfere with signals being sent to the communications and GPS antennae. Also, because the sensor is operating at high speeds, the sensor will shed vortices and create a turbulent wake as shown in the image below from NASA.

This wake will interfere with communication signals being sent to the antennae and would also be powerful enough to break off and destroy the antennae.
References
Gulfstream G550 Wikipedia Webpage – http://en.wikipedia.org/wiki/Gulfstream_G550
Gulfstream V Wikipedia Webpage – http://en.wikipedia.org/wiki/Gulfstream_V
Minimum Control Speed Wikipedia Webpage – http://en.wikipedia.org/wiki/Minimum_control_speeds
Reynold’s Number NASA Webpage – http://www.grc.nasa.gov/WWW/k-12/airplane/reynolds.html
Drag Over A Sphere NASA Webpage – http://www.grc.nasa.gov/WWW/k-12/airplane/dragsphere.html
Gulfstream G550 Data Book – http://www.corporatejet.com/documents/GulfstreamG550.pdf
UHF Antenna Webpage – http://www.hdtvprimer.com/antennas/siting.html
“Dynamics of Flight” book by Bernard Etkin and Lloyd Duff Reid